Implementing a Personal Finance Analytics Platform
Background
It’s funny how many personal projects of mine stem from some sort of annoyance at the lack of computable interfaces to every-day questions. Around two years ago, my wife and I decided to switch from our small hometown banks to Alliant Credit Union. Our hope was that we could avoid frankly atrocious websites and mobile applications indicative of not only our previous banks, but apparently most financial institutions in general. Alliant is an “online-only” bank which boasts an impressive mobile app and website, and honestly so-far I have to agree with them - mostly.
One thing that Alliant does that our previous banks didn’t is allow the user to
download transaction data across the entire history of their account as a
.csv (instead of only the last six months for my old bank). You can also do
this per-account and from a single dialog instead of having to click a million
places to obtain all of your data. However, the this data suffers from the same
problem as all other banks (as far as I can tell): the lack of rich content.
Take a look at the following line:
03/18/2020,"JETS PIZZA IL 017 248-980-6386 IL 03/17/20%% Card 17 #96",-$26.82,$100.00
The only data we get to work with is the transaction posting date, a cryptic description string, the amount withdrawn from the account, and the updated account balance after the transaction.
This is fine if I’m just wanting to track the progress of my account balance over time, or calculate spending averages across all forms of transactions, but otherwise it’s pretty useless at face value for digging deeper into my true spending habits. What would be much more useful to me, would be if the data looked something more like this:
{
  "account": "Checking",
  "amount": -26.82,
  "balance": 100.00,
  "bank": "Alliant Credit Union",
  "description": "JETS PIZZA IL 017 248-980-6386 IL 03/17/20% Card 17 #96",
  "name": "Jet's Pizza",
  "notes": "Guess we have to order pizza now!",
  "post_date": "2020/03/18",
  "tags": ["delivery", "fast-food", "food"],
  "transaction_date": "2020/03/17"
}
In particular, I am interesting in tagging transactions according to a certain hierarchy of categories so that I may fine-tune my analysis to specific subsets of the overall transaction data.
No surprise, this turns out to be a pain.
Categorizing Data
When searching for potential solutions online, everyone seems to suggest the same thing:
Just write a neural network to classify the data!
Which is a fine answer, except that I don’t want to black-box my methodology. I would personally prefer something that classifies transactions based on their description in a way that can be easily tweaked in a manner that is easy to understand.
The alternative is to leverage some kind of service that does the hard work for me, but to no-one’s surprise:
Cost: $500+/month
So I began to think on how I would like to categorize the data, and how the API for doing so would look (in Python).
I started by writing a function called parse_csv which builds a skeleton of
the transaction by converting the above .csv into a Python dictionary of the
following form:
{
 'bank': 'Alliant',
 'account': 'Checking',
 'date': datetime.datetime(2020, 03, 18, 0, 0),
 'desc': 'JETS PIZZA IL 017 248-980-6386 IL 03/17/20% Card 17 #96',
 'amount': -26.82,
 'bal': 100.00
}
The values for bank and account are just pulled from the file name, which
expects a file name of the form {bank}-{account}.csv.
From there, I figured the easiest thing to do was to build up a collection of
regular expressions to categorize the data into tags and “transaction names”. So
the next thing I did was write a class called Categorizer:
class Categorizer:
    '''
    An object that can translate a raw bank transaction.
    '''
    def __init__(self, data_directory):
        '''
        Creates a new transaction `Categorizer` built from the specified data
        directory.
        '''
    def cat(self, desc):
        '''
        An alias for `categorize`.
        '''
    def categorize(self, desc):
        '''
        Categorizes a transaction description, returning a "pretty" name for the
        transaction, as well as a collection of tags to assign the transaction.
        '''
    def categorize_transactions(self, transactions, macro=True, micro=True):
        '''
        Categorizes a list of transaction dictionaries. Also has the ability of
        categorizing any transaction with an absolute value <= $1 as a micro
        transaction and any >= $1000 as a macro transaction.
        '''
    def tcat(self, transactions):
        '''
        An alias for `categorize_transactions`.
        '''
The Categorizer class takes a path to a directory containing a bunch of
.yaml files containing the necessary classification specifications. Each of
these files looks somewhat like this:
# Restaurants & Food
# ------------------
tags:
  - "food"

data:
  - name: "Jet's Pizza"
    match: >
      jet'?s pizza
    tags:
      - "delivery"
      - "fast-food"
Each file contains a tags key, which defines a list of tags that apply to all
transactions that happen to match to a specification within the file, as well as
a data key, which defines a list of transaction match specifications. Each of
the match specifications defines a name for the transaction, a regular
expression on which to match the transaction (technically I’m using
re.search() against the .lower() of the desc string of each
transaction), and optionally an additional list of tags to apply.
A good bit of regular expressions later …
cat $(find . -name '*.yaml') | grep 'match:' | wc -l
341
… I managed to categorize 99.67% of the data and was finally comfortable extending my library to include some common transformations.
Filtering & Transforming Data
Arguably the most important function in my library is tfilter:
def tfilter(transactions, account=None, amount=None, bank=None, date=None, desc=None, name=None, negate=False, notes=None, tags=None):
    '''
    Filters a list of transactions according to a function filtering by:
      * bank
      * account
      * tags (as a set)
      * name
      * description
      * notes
      * dollar amount
      * date
      * Some combination of the above (applied in that order)
    In addition to functions/lambdas you can also specify:
      * A string for the `account` or `bank` keyword arguments. These
        comparisons are case-insensitive.
      * A list of tags for the `tags` keyword argument (at least one of those
        specified must be present for the transaction to be included).
      * A single tag string for the `tags` keyword argument. The transaction
        must contain the specified tag to be included.
      * A string for the `name`, `desc`, or `notes` keyword argument. These
        comparisons are case-insensitive and will match on substring as well.
      * A string for the `amount` keyword argument, being either `deposit` or
        `withdrawal`, their shorthand forms `d` or `w`, or `+` or `-`.
      * A tuple of integers or floats for the `amount` keyword argument. These
        are taken to constitute a range of amounts (inclusive).
      * An integer for the `date` keyword argument, indicating to filter by the
        `n` most recent days.
      * A date string of the form `%Y`, `%Y/%m`, or `%Y/%m/%d` for the `date`
        keyword argument.
      * A tuple of date strings for the `date` keyword argument, each of the
        form above. These are taken to constitute a range of dates (inclusive).
    If `negate` is set to True, then each filter specification is reversed. For
    example, if you specified an array of tag strings for the `tags` keyword
    argument but set `negate` to `True`, then the result of this function would
    be the list of all transactions that did _not_ contain any of the specified
    tags.
    '''
The above function allows me to easily filter things like so:
# Grab all food-related transactions within the last 90 days from all checking accounts.
filtered_data = tfilter(data, account='checking', date=90, tags='food')
The companion function to tfilter is tsort, which can sort a list of
transactions by a specific key (typically date). When chained with tfilter, it
allows you to begin asking some more meaningful questions about the data:
# What was the most I spent on groceries this month?
answer = tsort(tfilter(data, account='checking', date=30, tags='groceries'), key='amount')[0]['amount']
I also created functions like tmerge for merging two lists of transactions
(removing duplicates and trying to preserve entries with the most data),
tgroup for grouping transactions by some bucket amount (for example: weekly),
and tcounts for calculating how many times a particular type of transaction
occurs. In addition to all of the above, I created wrappers for the various
common statistical functions like mean, median, and standard deviation over a
list of transactions.
Graphical Analysis
With the implementations described in the previous section, I now had the ability to easily implement some basic numerical analysis of my financial data - the next step was graphical analysis.
I decided to build a graphical analysis library around Plotly with the goal of visualizing the data within Jupyter notebooks.
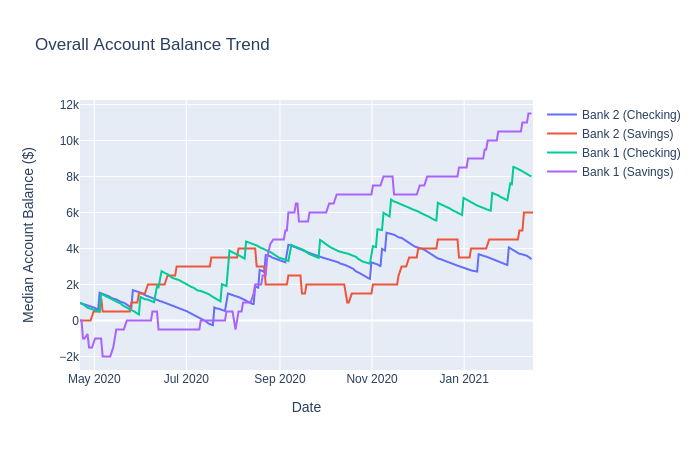
The plot above is an example trend plot generated by the library. It’s not the most accurate representation, sure, but you get the idea.
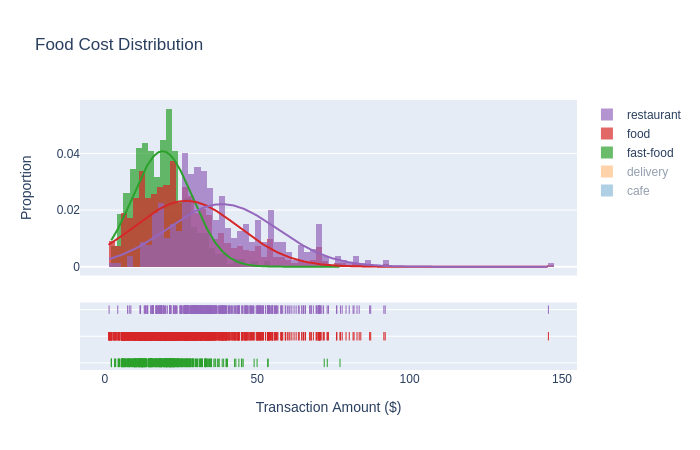
In addition to basic line & scatter plots, I can also plot spending distributions across sets of tags like so:
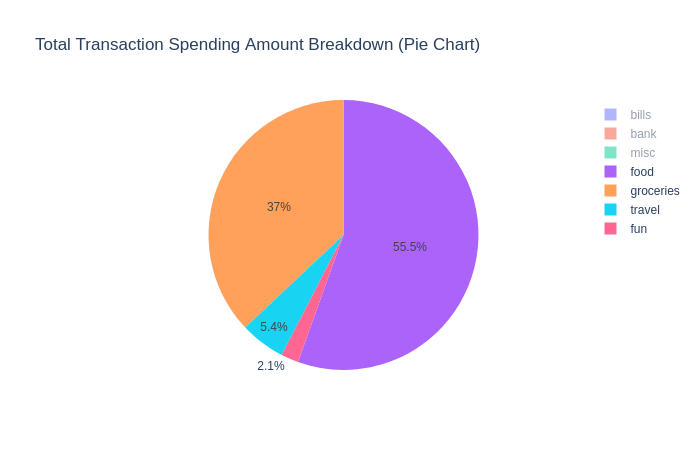
… or break-down the percentage of spending by tag:
Both the graphical and numerical methods above give my wife and I a greater bit of introspection into the current state of our personal finances, but it doesn’t give us a numerical answer as to the future state of our finances.
Data Projection
Over the last week, I have been working on supporting a variety of regression
fitting algorithms into a class I call FitModel:
- Boosted Decision Trees (BDT) (with AdaBoost)
- \(k\) Nearest Neighbors (KNN)
- Multilayer Perceptron Neural Networks (MLP)
- Ordinary Least Squares (OLS)
- Support Vector Machines (SVM) (with a variety of kernels)
This functionality is mostly at an exploratory state at the time of this writing. While I have utilized various machine learning techniques for classification purposes in the past, this is my first time attempting to predict data beyond the domain of the training set.
Below is a composite plot showing the active trendlines for three different algorithms on the fake data used above:
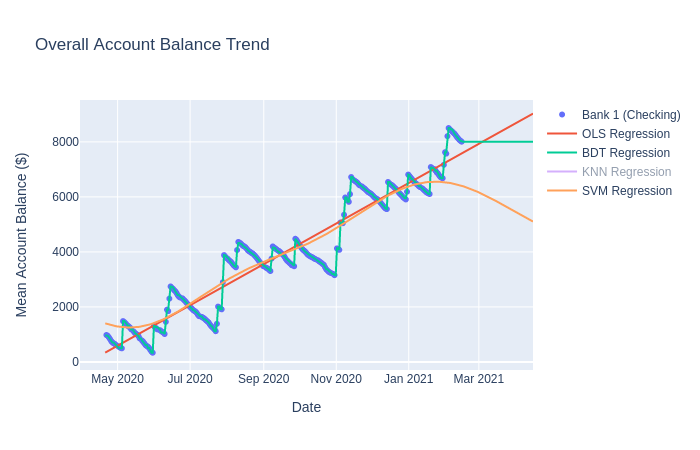
All-in-all, it has been really fun to get back into data science, especially in the context of something useful to me.
Outro
I realize it has been a while since I’ve posted in my blog. To be honest, I have about five or six different posts at 80% completion that are just sitting in my working tree. I tend to have “bursts” of blogging, so maybe over the next few weeks I’ll post more often.